Fuel cards for stronger expense control

Every dollar a driver spends at the pump without oversight is a dollar that could quietly erode your margins. For companies running five vehicles or five hundred, the difference between profitable operations and budget overruns often comes down to how fuel purchases are tracked and limited. The ExxonMobil business fuel card program gives fleet managers a direct mechanism for setting spending rules before drivers ever pull up to a station.

Why open-ended fuel spending creates problems

When drivers use personal credit cards or petty cash for fuel, the business loses visibility into what was purchased, where, and whether it was necessary. A 2024 Shell Fleet Solutions report found that companies using fleet cards with active monitoring reduced fuel misuse by 5 to 15 percent compared to those relying on reimbursement models. That gap grows wider as fleet size increases, because each additional vehicle multiplies the potential for unauthorized transactions.

Fuel expenses represent a significant share of total fleet costs. The U.S. Energy Information Administration reported that the average household spent roughly $2,148 on gasoline in 2024, and commercial operations with dozens of vehicles face proportionally larger bills. Without purchase controls, drivers can fill personal vehicles, buy premium grades when regular suffices, or make convenience store purchases on a fuel card tied to the company account.

How fuel cards enforce spending discipline

Fuel cards function as a policy enforcement layer between your budget and the point of sale. Managers can assign specific limits to each card, restricting the dollar amount per transaction, the number of fills per day, and even the type of fuel allowed. These controls happen automatically at the pump, so there is no need to chase down receipts or rely on trust alone.

The reporting tools built into modern fuel card platforms provide a real-time view of every transaction. Each swipe generates a record that includes the station name, location, time, gallon count, and price per gallon. That level of tracking makes it straightforward to spot anomalies, such as a driver filling a 20-gallon tank three times in one day or fueling at stations far outside their assigned route.

According to Grand View Research, branded fuel cards held a 45.9 percent share of the U.S. fuel card market in 2024, largely because businesses value the combination of discounts and spending restrictions these products offer. The broader U.S. fuel card market reached $88.03 billion that year, reflecting how deeply these tools have become embedded in fleet operations.

Setting limits that match your operations

Effective expense control requires limits that reflect how your fleet actually operates. A delivery driver covering 200 miles daily needs a different fuel allowance than a technician making local service calls. Fuel cards let you set those parameters at the individual card level.

Some businesses restrict cards to specific station networks, ensuring drivers only fuel at locations where the company has negotiated volume discounts. Others set time-of-day restrictions to prevent after-hours usage, cutting off access during weekends or overnight hours when company vehicles should be parked. The flexibility means each card becomes a customized spending policy that drivers carry in their wallets, and the policies adapt as routes and assignments change.

This granular approach to management also reduces the administrative burden of reconciling expenses. Instead of sorting through a stack of paper receipts at month end, the accounting team can export transaction data directly into their financial software. The savings in labor hours alone often justify the switch from traditional reimbursement models.

Real-time monitoring catches problems early

Waiting until the end of a billing cycle to review fuel spending means problems compound for weeks before anyone notices. Real-time monitoring changes that dynamic. Fleet managers receive alerts when a transaction exceeds preset thresholds, when a card is used outside approved hours, or when fueling patterns deviate from established norms.

This security layer protects against both internal misuse and external fraud. If a card number is stolen and used at a station 500 miles from the assigned vehicle, the system flags it immediately. Approximately 90 percent of U.S. fleet cards now require driver data entry (such as odometer readings or driver IDs) at the point of purchase, creating an additional verification step that deters unauthorized use.

The convenience of having all this data in one dashboard also simplifies compliance reporting. Businesses subject to IFTA fuel tax requirements can pull station-level data by state, eliminating manual mileage logs and reducing the risk of audit penalties.

Connecting fuel data to broader fleet efficiency

Fuel cards generate more than expense reports. The transaction data they collect feeds into broader fleet optimization strategies. When you know exactly how many gallons each vehicle consumes per mile, you can identify which trucks or vans are underperforming and schedule maintenance before efficiency drops further.

Telematics integration amplifies this effect. About 60 percent of new fleet vehicles in 2024 came equipped with telematics hardware that connects directly to card-based tracking systems. That integration grew 34 percent year over year, according to Market Growth Reports. The combined data stream lets managers correlate fueling patterns with route efficiency, idle time, and driver behavior.

For businesses exploring ways to optimize their total cost of ownership, fuel cards serve as the data foundation. The transaction records, when paired with maintenance logs and route data, reveal where money is being wasted and where operations run well.

Choosing the right card for your fleet

The fleet card market has expanded significantly, with the global commercial fleet fuel card segment valued at $11.25 billion in 2024 and projected to reach $16.87 billion by 2029. That growth has produced a range of solutions tailored to different fleet sizes and needs.

Small fleets with fewer than 20 vehicles often benefit from cards tied to a specific fuel network, where volume-based discounts at partner stations offset the narrower access. Larger operations tend to favor universal cards accepted at multiple networks, trading some discount depth for broader geographic coverage.

What matters most is matching the card to your operational reality. Consider your routes, your drivers, your fuel volume, and your appetite for administrative work. The right fuel card does not just reduce costs at the pump. It gives you the data and control to run tighter operations across every aspect of fleet management.

Fuel cards have moved well beyond simple payment convenience. They are now central to how businesses track expenses, enforce spending policies, monitor driver behavior, and plan for growth. The companies getting the most value from them treat the card not as a payment method, but as a management tool that touches every part of their fleet operations.


Increasing Fleet Savings With Fuel Cards for Small Businesses

Fuel is often the largest variable expense a small business faces when it operates even a handful of vehicles. Unlike fixed costs such as insurance premiums or lease payments, fuel spending shifts with prices at the pump, driver habits, and route efficiency. Small businesses rarely have a dedicated fleet manager watching every transaction, which makes fuel waste easy to miss. Corporate gas card programs built for commercial fleets give these smaller operations the same purchase controls and reporting tools that large carriers have used for years.

Why small businesses lose money on fuel without dedicated controls

A five-truck delivery company spending $8,000 per month on fuel probably processes those transactions across personal credit cards, cash reimbursements, or a single company card with no restrictions. None of those methods tell the business owner what each driver spends per route, which stations offer the best pricing, or whether fuel purchases line up with actual mileage.

The numbers behind this problem are significant. Industry analysis shows fuel accounts for roughly 49 percent of commercial fleet operational costs. For a small business operating on thin margins, even a 5 percent reduction in fuel spending can shift profitability. Yet without transaction-level tracking, there is no reliable way to identify where the waste occurs.

Small and medium enterprises led fleet card adoption by enterprise size in 2024 according to Allied Market Research, a sign that these businesses are recognizing the cost of operating without proper fuel management tools. The convenience of a dedicated card program replaces guesswork with data, giving even a five-vehicle operation access to the same reporting and spending controls that national carriers rely on. The ability to reduce waste through data rather than guesswork levels the playing field.

How fuel cards create savings through discounts and rebates

Fleet fuel cards generate savings at two levels. The first is direct: per-gallon rebates negotiated between the card provider and fuel stations in their network. These discounts apply automatically at the pump and scale with volume, meaning the more fuel a business purchases, the better the per-gallon rate.

The second level is indirect but often larger. Shell Fleet Solutions reported in 2024 that fleet managers using their monitoring and analytics tools achieved 5 to 15 percent fuel cost reductions. Those savings came from identifying inefficient routes, catching unauthorized purchases, and detecting vehicles with mechanical issues that were burning fuel faster than normal.

The U.S. fuel card market reflects this dual value proposition. Grand View Research reported the market reached $88.03 billion in 2024 and projects it will grow at a 9.4 percent compound annual growth rate through 2030. Branded fuel cards, which restrict purchases to a single network in exchange for deeper discounts, accounted for 45.9 percent of the market. For small businesses that operate within a concentrated geographic area, a branded card’s network coverage and pricing often delivers the best return.

Tracking driver behavior and fuel purchase patterns

Each fuel card transaction records the driver, vehicle, station, time, fuel type, volume, and cost. When these data points accumulate over weeks and months, patterns emerge that would be invisible with receipt-based tracking.

A driver who consistently fills up at premium stations when the company policy calls for regular grade is costing the business money on every gallon. A vehicle that requires more frequent fills than comparable trucks in the fleet may have a maintenance issue. A card used on a day the assigned driver was off the schedule signals potential misuse.

A 2025 industry survey found that 62 percent of fleets use fuel cards, with 49 percent citing easier expense tracking as a top benefit. The reporting dashboards that come with most fleet card programs sort this information into summaries by driver, by vehicle, and by time period, making the data usable without requiring a finance background. For small businesses without dedicated accounting staff, this efficiency matters. Generating a monthly fuel summary broken down by driver or route eliminates hours of manual reconciliation and gives the business owner a clear picture of where every dollar went.

Setting purchase limits that match your fleet’s needs

Fleet fuel cards allow business owners to set spending limits at the card level. These controls can restrict daily spending caps, limit the number of transactions per day, block non-fuel purchases, and confine buying to approved stations within the card’s network.

For a small business, this level of control means the owner does not need to review every transaction manually. The card itself enforces the rules. If a driver tries to buy $200 worth of convenience store items on a fuel card capped at fuel-only purchases, the transaction declines at the register.

Transaction security extends beyond spending limits. Cards can require a PIN or odometer entry at the pump, tying each purchase to a verifiable data point. If a card is lost or stolen, it can be frozen through the card management portal within seconds. These security features protect a small business’s fuel budget without requiring constant monitoring from the owner.

Simplifying expense reporting and tax preparation

Manual fuel expense tracking means collecting receipts, matching them to driver logs, categorizing spending, and reconciling everything against bank statements. For a small business owner already handling sales, scheduling, and customer service, this process often gets delayed or done poorly.

Fleet fuel cards automate this entirely. Every transaction is logged with the details needed for both internal reporting and tax filings. Fuel tax credits, state-by-state fuel purchases for IFTA reporting, and category breakdowns are available as downloadable reports rather than reconstructed from shoeboxes of paper receipts.

The commercial fleet fuel card market grew to $11.25 billion in 2024 and is forecasted to reach $16.87 billion by 2029, according to Business Wire. A portion of that growth comes from small businesses that previously managed expenses manually and switched to card-based systems for the reporting alone.

Choosing a fuel card that fits a small fleet’s operations

The fleet card market offers multiple solutions tailored to different business sizes. Universal cards provide access to broad station networks, which suits fleets that cover unpredictable routes. Closed-loop cards restrict stations but typically offer better per-gallon pricing.

In 2023, 38 percent of new fleet cardholders selected universal cards for their flexibility across multiple fuel brands. For a small business with drivers who stay within a region served by a single brand, a branded card’s deeper discounts may optimize costs more effectively.

What matters most is whether the card’s network, reporting tools, and cost structure match how the business actually operates. A card that offers excellent rebates at stations 50 miles outside the fleet’s territory adds no value. Small fleet owners should evaluate which stations their drivers already use, what level of spending control they need, and whether the card platform’s reporting can replace their current tracking methods.

The integration between fuel card platforms and telematics systems grew 34 percent in 2024 according to Market Growth Reports, a trend that benefits small businesses as much as large ones. Even basic telematics data combined with fuel card records can reveal whether a vehicle’s fuel consumption aligns with its mileage. When those pieces align, fuel cards turn an unpredictable variable expense into a managed, measurable line item that the business can plan around with confidence.

Fleet cards help businesses control fuel spending and improve cost visibility

Processing fuel reimbursements through expense reports is one of the fastest ways to lose track of where fleet dollars actually go. Receipts get lost, drivers round up, and the accounting team spends hours matching paper to payments with no reliable way to verify accuracy. Switching to a dedicated program like Speedway fleet cards for fuel cost control replaces that manual process with automated tracking that captures every transaction at the pump.

Why fuel spending spirals without structured controls

Fuel is the single largest variable expense for most fleet operations. The U.S. Energy Information Administration reported average gasoline prices of $3.30 per gallon and diesel at $3.76 per gallon in 2024. At those prices, a fifty-vehicle fleet consuming 500 gallons per truck per month faces a fuel bill exceeding $90,000 before accounting for price spikes, inefficiency, or unauthorized purchases.

Without structured controls, spending creeps upward through small, hard-to-detect channels. A driver fills a personal vehicle on a company card. Another driver chooses a premium grade that the vehicle does not require. Someone buys snacks and drinks at the station on the company tab. Each incident costs relatively little on its own, but across a fleet and over months, these leaks become a significant budget problem.

Fleet cards address this by imposing rules at the point of purchase. When a driver swipes the card, the system checks fuel type restrictions, gallon limits, time-of-day windows, and geographic boundaries before authorizing the transaction. If any restriction is violated, the card declines. The control happens before the money is spent, not during the next accounting review.

How transaction data builds cost visibility

Cost visibility starts with capturing the right data. Standard business credit cards record the merchant name and total amount. Fleet cards record the station, fuel grade, gallons pumped, price per gallon, vehicle ID, driver number, and odometer reading. That difference in data depth is the foundation of effective expense management.

Roughly 90% of U.S. fleet cards require drivers to enter vehicle and mileage information at the pump, producing close to one billion tracked inputs per year according to a 2024 Visa fleet payment study. Every input becomes a line item that feeds into the reporting dashboard. Fleet managers can filter by driver, vehicle, route, date range, or station to isolate exactly where fuel dollars are going.

This monitoring capability transforms fuel from a bulk expense line into a category the business can actively manage. When a vehicle’s cost per mile starts climbing, the data points to whether the cause is higher fuel prices at certain stations, declining vehicle efficiency, or a driver refueling more often than the route requires.

Real-time dashboards versus monthly statements

The timing of information matters as much as its quality. A monthly credit card statement tells you what happened four to six weeks ago. A real-time fleet card dashboard tells you what happened this morning.

Shell Fleet Solutions reported in Q1 2024 that fleet managers using their real-time analytics tools reduced fuel costs by 5% to 15%. Those savings came from acting on data quickly: flagging unusual transactions the same day they occurred, adjusting purchase limits when routes changed, and identifying drivers whose refueling patterns deviated from fleet norms.

The commercial fleet fuel card market reached $11.25 billion in 2024, growing at 8.7% annually. A significant driver of that growth is the demand for platforms that deliver live reporting rather than batch summaries. Businesses want to see spending as it happens, not reconstruct it after the billing cycle closes. That access to real-time information is what separates active cost control from passive expense tracking.

Setting controls that match your fleet’s operations

Effective fuel spending control requires restrictions that reflect how the fleet actually operates. A long-haul trucking company needs different rules than a regional delivery service. Fleet card platforms allow managers to configure:

– Fuel type limits per vehicle (diesel for trucks, regular for passenger vehicles)

– Gallon caps per transaction, per day, or per week

– Approved station networks where negotiated discounts apply

– Time restrictions that match driver shift schedules

– Category blocks that prevent non-fuel purchases

These settings reduce unauthorized spending without creating friction for drivers doing their jobs correctly. A driver on an approved route buying the right fuel within normal hours will never notice the restrictions. A driver attempting to fill a personal car on a Saturday morning will get a declined transaction and an automatic alert sent to the fleet manager.

Registered fleet cards accounted for $1.22 billion of the global fuel card market in 2024, growing at 6.8% per year according to FactMR. That segment’s growth reflects the security value of cards tied to specific drivers and vehicles, with purchase rules enforced at the network level.

Savings through network access and rebate structures

Preventing bad spending is half the equation. The other half is optimizing the spending that needs to happen. Fleet cards offer savings through per-gallon discounts, volume-based rebates, and preferred station pricing.

Branded cards held 45.9% of the U.S. fuel card market in 2024, largely because they offer discounts tied to a specific station network. For fleets with predictable routes and good coverage from a single brand, those discounts produce reliable per-gallon savings that add up across hundreds of fill-ups per month.

Open network cards provide access to a broader range of stations, which benefits fleets covering large or unpredictable territories. The North America commercial fuel card market reached $201.6 billion in 2025 per Transparency Market Research, and multi-network cards represented 38% of new enrollments in 2023. The trade-off is slightly lower per-gallon discounts in exchange for greater convenience and flexibility.

The right choice depends on route patterns, geographic spread, and total monthly volume. Fleet managers who analyze their fueling data (station locations, frequency, average price paid) can match the card’s network to the fleet’s actual behavior and reduce costs on both ends: cutting waste through controls and cutting price through rebates.

Connecting fuel data to broader fleet management

Fleet cards become more powerful when their data connects to other business systems. Telematics platforms, for example, provide real-time vehicle location, idle time, and actual miles driven. When that data feeds into the same dashboard as fuel card transactions, fleet managers get a complete picture of operational efficiency.

Industry data from 2024 shows that 60% of new fleet vehicles come equipped with telematics, and 47% of fleet card providers now offer integrated analytics solutions. This connection automates odometer reporting, validates route compliance, and enables precise fuel-efficiency calculations per vehicle.

The global fuel cards market is projected to grow from $1.62 billion in 2024 to $3.1 billion by 2034 at a 6.7% compound annual growth rate. That growth tracks with a broader shift toward integrated fleet management, where fuel expenses are not tracked in isolation but as part of a connected system that includes maintenance, routing, driver performance, and total cost of operations. Companies that use these tools to optimize routes, refueling schedules, and driver behavior see compounding returns over time. For businesses looking to bring genuine control and visibility to their fuel spending, the fleet card is the access point to that system.

Fleet fuel cards for driver accountability

Fuel fraud costs U.S. businesses an estimated 5 to 15 percent of their total fuel spend, according to a 2024 Shell Fleet Solutions report. For a fleet burning through $50,000 a month in diesel alone, that translates to $2,500 to $7,500 in losses that rarely show up as a single dramatic event. Instead, the money leaks out in small, hard-to-detect transactions: personal fills, buddy fueling, and grade upgrades that go unquestioned. Programs like the fleet fuel card options from ExxonMobil address this directly by creating a digital paper trail for every purchase a driver makes.

The security gap in traditional fueling

Companies that reimburse drivers for fuel using expense reports or petty cash have limited ability to verify what actually happened at the pump. A receipt shows a dollar amount and a station name, but it does not confirm whether the fuel went into a company vehicle, a personal car, or a friend’s truck parked at the next island. This verification gap is where fraud thrives.

Fleet fuel cards close that gap by tying each transaction to a specific card, which can be linked to a specific vehicle and driver. When the card is swiped, the system captures the station location, time, fuel type, gallon count, and price. Roughly 90 percent of U.S. fleet cards now require drivers to enter additional data at the point of sale, such as odometer readings or personal identification numbers. That extra layer of driver accountability makes it significantly harder to misuse the card without leaving evidence.

How transaction limits prevent unauthorized spending

The most effective security feature on a fleet fuel card is the spending limit. Managers can restrict each card by dollar amount per transaction, number of fills per day, fuel type, and even the hours during which the card is active. A driver assigned to a local delivery route with a 30-gallon tank does not need access to $200 in diesel at 11 p.m. on a Saturday. Setting those limits in advance eliminates the need for after-the-fact investigations.

Purchase controls also prevent non-fuel spending. Some cards can be locked to fuel-only transactions at stations, blocking convenience store purchases, car washes, or other ancillary expenses that inflate costs. This level of control turns the card from a simple payment method into an active policy enforcement tool.

The reporting dashboard that accompanies most fleet fuel card programs displays every transaction as it happens. Fleet managers can review spending by driver, by vehicle, or by station, and drill down into individual transactions when something looks off. That kind of real-time monitoring replaces the month-end guessing game with data you can act on immediately.

Matching fuel data to vehicle performance

Tracking fuel purchases does more than catch theft. When every fill-up is logged with an odometer reading, the system calculates miles per gallon for each vehicle in the fleet. A truck averaging 8 MPG that suddenly drops to 6 MPG is signaling a maintenance issue, whether it is a clogged air filter, underinflated tires, or a more serious mechanical problem. Catching that early saves both fuel costs and repair expenses.

This data also reveals driver behavior patterns. Two drivers covering the same route in identical vehicles should have similar fuel consumption. When one consistently burns 20 percent more fuel than the other, the numbers point to aggressive driving habits like hard acceleration, excessive idling, or speeding. Fleet managers can use this data for targeted coaching rather than blanket policies that penalize efficient drivers along with wasteful ones.

About 60 percent of new fleet vehicles in 2024 came equipped with telematics hardware, and integration between telematics and fleet card platforms grew by 34 percent that year. Combined, these systems give managers a comprehensive view of how vehicles are being used, fueled, and maintained across the entire network of operations.

Building a culture of accountability without micromanaging

Driver accountability works best when it is built into the system rather than enforced through confrontation. Fleet fuel cards create automatic guardrails that apply equally to everyone. When the limits are clear and the tracking is transparent, drivers know that purchases are monitored, and that knowledge alone deters most misuse.

The convenience factor also matters. Drivers do not have to pay out of pocket and wait for reimbursement. They do not have to save paper receipts or fill out expense forms. The card handles the transaction, the system logs the data, and the accounting team exports the records directly. This reduction in administrative friction benefits both sides.

For businesses managing vehicles across multiple locations, centralized access to fuel spending data simplifies what would otherwise be a logistics nightmare. A fleet spread across six states can be monitored from a single dashboard, with alerts configured to flag anomalies by region, driver, or vehicle. The efficiency gains extend well beyond fraud prevention into route planning, budget forecasting, and vendor negotiations.

The scale of fleet card adoption

The commercial fleet fuel card market reached $11.25 billion globally in 2024 and is projected to grow at 8.4 percent annually through 2029, according to a ResearchAndMarkets report published in early 2026. More than 78 percent of large fleet operators (those with over 50 vehicles) already use fleet cards as their primary fueling management tool. In the United States alone, over 10 million fleet cards were active in 2023.

Small and mid-sized fleets are adopting these solutions at increasing rates as well. Javelin Strategy noted in 2024 that small fleets represent the largest remaining growth opportunity for card providers, partly because these businesses stand to gain the most from the expense tracking and spending control features that larger companies have relied on for years.

Branded fuel cards, including those tied to specific station networks, held a 45.9 percent share of the U.S. fuel card market in 2024. These cards often offer per-gallon discounts at partner stations, adding a savings layer on top of the security and reporting benefits. For fleets that operate within a defined geographic area where partner stations are plentiful, the discount structure can meaningfully reduce overall fuel costs.

What accountability actually looks like

Driver accountability is not about punishing people. It is about giving the business the visibility it needs to manage fuel as the major expense category it is. Fleet fuel cards provide the data, the controls, and the reporting infrastructure to optimize spending across the fleet while keeping transactions transparent.

When every fill-up is tracked, every limit is enforced, and every anomaly triggers a notification, the system runs on data instead of trust. That shift protects the bottom line without creating an adversarial relationship between management and the drivers who keep the fleet moving.

DeFi Hash Expands Mobile Cloud Infrastructure Platform Amid Rising Demand for Digital Asset Participation

As the cryptocurrency industry continues to mature in 2026, investors are exploring new ways to participate in digital assets beyond traditional buy-and-hold strategies. Simultaneously, global demand for mobile-first fintech and cloud infrastructure continues to accelerate.

DeFi Hash announced the expansion of its mobile cloud infrastructure platform, aiming to enhance the ease of digital asset participation through distributed computing services and mobile technology integration.

The company stated that its platform aims to reduce many traditional barriers to cryptocurrency infrastructure participation, such as high hardware costs, energy consumption, technical complexity, and ongoing maintenance.

Users can access cloud-based computing contracts through the DeFi Hash mobile app and web platform, eliminating the need to purchase or manage physical mining equipment. The platform offers features such as contract management, real-time account monitoring, automated settlement, and performance tracking, and supports mobile device access.

According to the company, DeFi Hash currently has over 3.5 million registered users globally and operates through a centralized computing resource allocation system designed to support scalable infrastructure participation.

The company also highlighted several broader market trends driving the resurgence of cloud computing infrastructure, including increased institutional investor participation in the Bitcoin market, continued inflows of ETF-related funds, intensified consolidation among large mining operators, and growing global demand for AI-driven computing power.

Industry analysts noted that one of the most significant developments in this sector is the convergence of digital asset infrastructure with AI computing. In North America and other global regions, infrastructure operators are increasing their investments in AI data centers, high-performance computing (HPC), and GPU-based systems to support the growing AI workloads.

As demand for massive computing resources continues to grow, computing infrastructure is increasingly seen as a key component of the broader digital economy. Market observers believe this shift is accelerating interest in mobile cloud services and automated digital asset participation models.

DeFi Hash stated that its platform integrates multi-layered security and infrastructure protection, including transaction monitoring systems, encrypted account protocols, and global cybersecurity support mechanisms.

The company also announced that it will offer a range of participation products through the platform, including trial contracts, infrastructure participation packages, and long-term cloud computing contracts designed for different levels of user participation.

According to the company, new users may be eligible for registration rewards and limited-time trial opportunities.

As the digital asset industry continues to evolve, analysts are increasingly focusing on AI-driven infrastructure, cloud computing services, automated asset management systems, and mobile participation platforms, believing these to be key growth areas shaping the industry’s future.

DeFi Hash stated that it plans to continue expanding its global cloud infrastructure ecosystem and support broader digital asset technology participation through scalable cloud service models.

Media Contact:

info@defihash.com

Official Website: DeFi Hash

How Long Does Kitchen Remodel Take in Utah? A Week-by-Week Contractor Timeline

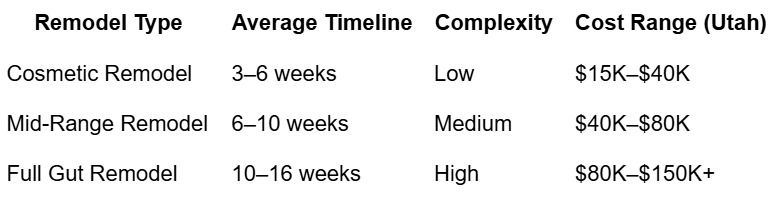
If you’re asking how long does kitchen remodel take Utah, you’re likely planning a major upgrade and trying to avoid living in construction chaos longer than necessary. In Utah, a standard kitchen remodel typically takes 6 to 12 weeks, depending on design complexity, permit approval, material availability, and structural changes.

A simple cosmetic remodel (paint, cabinets, countertops) may finish in under 6 weeks, while a full renovation involving plumbing, electrical relocation, and layout changes can extend beyond 3 months.

This timeline also varies across Utah cities like Salt Lake City, Provo, and Park City due to inspection schedules, contractor availability, and seasonal weather delays that can affect material delivery.

Below is a real contractor-style breakdown so you understand exactly what happens each week of your kitchen remodel.

What Impacts How Long Does Kitchen Remodel Take Utah Projects?

Before breaking down the timeline, it’s important to understand what actually affects duration.

Key Factors That Change Timeline:

  • Permit approval speed (2–6 weeks in most Utah cities)
  • Scope of work (cosmetic vs full gut remodel)
  • Structural modifications (walls, plumbing, gas lines)
  • Cabinet and material lead times
  • Contractor scheduling availability
  • Inspection delays from local building departments

Utah building codes also require inspections at multiple stages, especially for electrical and plumbing upgrades, which can extend the schedule if inspectors are backlogged.

Week-by-Week Kitchen Remodel Timeline in Utah

Here is a realistic contractor timeline based on mid-range kitchen remodels.

Weeks 1–2: Design, Planning & Permits

  • Final layout design and material selection
  • Cabinet ordering begins (lead time 3–8 weeks)
  • Permit submission to local city office
  • Electrical and plumbing planning

Weeks 3–4: Demolition Phase

  • Removal of old cabinets and flooring
  • Wall demolition (if required)
  • Utility disconnection (gas, water, electricity)
  • Structural inspection if needed

At this stage, homeowners often consult kitchen remodelers Park City Utah to ensure structural changes comply with mountain-region building requirements and snow-load standards.

Weeks 5–6: Rough-In Work (Mechanical Stage)

  • Plumbing pipe relocation
  • Electrical rewiring
  • HVAC adjustments
  • Framing corrections or wall modifications

This stage is critical because everything behind the walls must pass inspection before closing.

Contractors like Renovation Brothers often emphasize this phase because mistakes here can cause expensive delays later in the project.

Weeks 7–9: Drywall, Flooring & Cabinet Installation

  • Drywall installation and finishing
  • Painting primer coats
  • Cabinet installation begins
  • Flooring installation (tile, hardwood, or vinyl)

Typical Delays in Utah:

  • Backordered cabinets (common in peak season)
  • Flooring acclimation delays due to humidity changes
  • Inspection rescheduling

Weeks 10–11: Countertops, Fixtures & Finishing

  • Countertop measurement and installation
  • Sink and faucet installation
  • Lighting fixture placement
  • Appliance delivery and setup

Quartz countertops often take 7–10 days after measurement, which is a common scheduling bottleneck.

Week 12: Final Inspection & Completion

  • Final city inspection
  • Touch-up work
  • Cabinet hardware installation
  • Final walkthrough with contractor

At this stage, everything should be fully operational and code-compliant.

Kitchen Remodel Timeline Comparison (Utah Projects)

Common Delays That Extend Kitchen Remodel Time

Even well-planned projects face delays. In Utah, the most common ones include:

1. Permit Backlogs

Local municipalities like Salt Lake County often experience 2–4 week delays in peak construction seasons.

2. Material Supply Chain Issues

Custom cabinets and imported countertops can delay timelines by several weeks.

3. Change Orders

Mid-project design changes can reset timelines significantly.

4. Inspection Failures

Incorrect wiring or plumbing installation can require rework before approval.

How to Speed Up Your Kitchen Remodel in Utah

If you want a faster project timeline, follow these strategies:

  • Finalize design before demolition starts
  • Order all materials upfront
  • Avoid mid-project changes
  • Hire experienced contractors familiar with Utah codes
  • Schedule inspections early

Working with experienced teams like kitchen remodelers Park City Utah can significantly reduce delays because they already understand local permit workflows and inspection patterns.

Cost vs Time Relationship in Kitchen Remodeling

In Utah, faster projects usually cost more because:

  • Labor is compressed into shorter timelines
  • Premium scheduling priority is required
  • Expedited material shipping fees apply

Typical trade-off:

  • Faster remodel = +10% to +25% cost increase
  • Standard timeline = most cost-efficient option

Final Thoughts on Kitchen Remodel Timelines in Utah

Understanding how long does kitchen remodel take Utah helps homeowners set realistic expectations and avoid frustration during construction. Most projects fall within a 6–12 week window, but planning, permits, and material selection heavily influence the final timeline.

Choosing experienced professionals like Renovation Brothers ensures your project stays on schedule, meets Utah building codes, and avoids costly delays caused by poor sequencing or permit issues.

5. FAQ Section

1. How long does a kitchen remodel take in Utah on average?

A kitchen remodel in Utah typically takes 6 to 12 weeks depending on complexity. Cosmetic updates are faster, while full remodels involving plumbing, electrical, or structural changes take longer due to permits and inspections.

2. What is the biggest delay in kitchen remodeling projects?

The most common delays are permit approvals, material backorders, and inspection scheduling issues. Custom cabinets and countertops often take the longest to arrive, especially during peak construction seasons in Utah.

3. Do I need a permit for a kitchen remodel in Utah?

Yes, permits are required if you change plumbing, electrical systems, or structural layouts. Simple cosmetic updates like painting or cabinet replacement usually do not require permits in most Utah cities.

4. Can I live in my home during a kitchen remodel?

Yes, most homeowners stay in their homes during remodeling. However, expect limited kitchen access for several weeks. Contractors often set up temporary cooking areas to minimize disruption during construction.

5. What is the fastest way to complete a kitchen remodel?

The fastest way is to finalize design early, order materials in advance, and avoid mid-project changes. Hiring experienced local contractors familiar with Utah permitting also helps significantly reduce delays.

Cost Comparison: Trenchless vs Traditional Sewer Repair in Washington

Understanding trenchless vs traditional sewer repair cost is essential for Washington homeowners dealing with sewer line failures, backups, or aging underground pipes. In cities like Seattle, Tacoma, and Bellevue, many homes were built decades ago with clay or cast iron sewer systems that are now reaching failure points. The repair method you choose directly affects not only cost but also property damage, restoration needs, and long-term durability.

In Washington State, heavy rainfall, shifting soil, and tree root intrusion make sewer damage more common than many homeowners expect. Traditional excavation and trenchless technology are the two main repair approaches, but their costs and impacts vary significantly. This guide breaks down real-world pricing, pros and cons, and when each method makes financial sense so you can make an informed decision before committing to costly repairs.

What Impacts Trenchless vs Traditional Sewer Repair Cost in Washington

Before comparing methods, it’s important to understand what drives pricing in Washington’s plumbing market.

Key cost factors include:

  • Pipe depth and accessibility
  • Length of sewer line needing repair
  • Soil conditions (rock, clay, saturated ground)
  • Root intrusion severity
  • Permit requirements in local cities
  • Restoration needs (driveways, landscaping, flooring)

Washington-specific conditions affecting cost:

  • High groundwater levels increase excavation difficulty
  • Dense urban housing limits equipment access
  • Mature trees increase root-related damage
  • Older infrastructure often requires full replacement, not patch repair

These conditions make Seattle and surrounding cities slightly more expensive than national averages.

Trenchless Sewer Repair Cost Breakdown in Washington

Trenchless technology avoids digging long trenches and instead repairs pipes underground using modern methods.

Average trenchless costs in Washington:

  • Basic pipe lining: $80–$250 per linear foot
  • Pipe bursting replacement: $100–$300 per linear foot
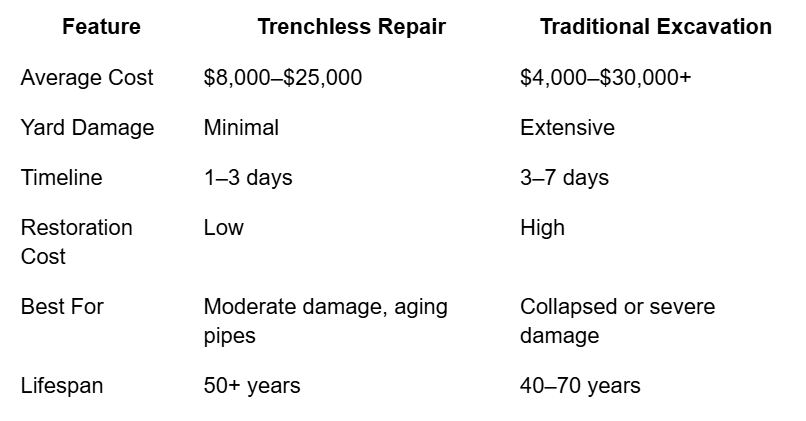
  • Full residential project: $8,000–$25,000

Advantages:

  • Minimal yard or driveway damage
  • Faster completion (often 1–2 days)
  • Lower restoration costs
  • Ideal for landscaped or tight properties

Disadvantages:

  • Higher upfront cost than digging
  • Not suitable for collapsed or severely misaligned pipes
  • Requires specialized equipment and expertise

Example scenario:

A 50-foot sewer line replacement in Seattle using trenchless methods may cost $10,000–$18,000 depending on soil and access conditions.

Traditional Sewer Repair Cost Breakdown in Washington

Traditional repair involves excavation of the affected sewer line and full replacement.

Average traditional repair costs:

  • Basic excavation repair: $50–$200 per linear foot
  • Full sewer line replacement: $4,000–$15,000
  • With restoration (landscaping, concrete): $10,000–$30,000+

Advantages:

  • Lower initial installation cost
  • Suitable for collapsed or heavily damaged pipes
  • Easier inspection and full replacement visibility

Disadvantages:

  • Major yard and driveway disruption
  • Higher restoration costs after repair
  • Longer project timelines
  • Heavy equipment required

Example scenario:

A full 60-foot traditional sewer replacement in Seattle may cost $8,000–$20,000, but restoration can add another $5,000–$10,000.

Trenchless vs Traditional Sewer Repair Cost Comparison Table

When Trenchless Repair Makes More Financial Sense

Trenchless is often the smarter long-term investment in Washington homes when:

  • Sewer lines are still structurally intact
  • Property has expensive landscaping or hardscape
  • Home is in dense Seattle neighborhoods
  • Fast repair is needed with minimal disruption

Real-world insight:

In Seattle’s high-value residential areas, homeowners often choose trenchless even if upfront costs are 15–30% higher because restoration savings can outweigh installation costs.

For homeowners comparing pricing in detail, many contractors provide breakdowns such as trenchless sewer repair cost Seattle estimates based on pipe length and inspection results.

When Traditional Sewer Repair Is the Better Option

Traditional excavation is still necessary in certain situations:

  • Pipe has fully collapsed
  • Severe misalignment or bellies in sewer line
  • Access is already open due to construction
  • Budget is the primary concern over surface restoration

Contractor insight:

In older Seattle homes with Orangeburg piping, full excavation is often unavoidable due to complete pipe degradation.

Local contractors like Aces Four frequently assess whether trenchless or traditional methods are structurally viable before recommending a solution.

Hidden Costs Homeowners Often Overlook

Many homeowners focus only on installation cost, but additional expenses can significantly impact total budget.

Hidden cost factors:

  • Permit fees ($200–$1,500 depending on city)
  • Soil restoration and grading
  • Driveway or sidewalk replacement
  • Emergency service surcharges
  • Sewer camera inspection ($150–$500)

In Washington, restoration often becomes a major part of traditional repair costs.

Environmental and Long-Term Value Considerations

Seattle’s environmental conditions make durability a major factor in cost efficiency.

Long-term considerations:

  • Trenchless pipes often last 50+ years
  • PVC replacements resist root intrusion better than older materials
  • Traditional excavation may disturb soil stability
  • Reduced environmental disruption with trenchless methods

While upfront costs vary, lifecycle value often favors trenchless solutions in urban Washington settings.

Choosing the Right Method for Your Home

Step-by-step decision guide:

1. Schedule sewer camera inspection

2. Identify pipe condition and failure type

3. Compare repair feasibility (trenchless vs excavation)

4. Evaluate restoration costs for your property

5. Get multiple contractor estimates

Working with experienced professionals ensures accurate diagnosis before committing to expensive repairs.

Why Professional Assessment Matters in Washington

Sewer systems in Washington are highly location-dependent due to:

  • Aging infrastructure in Seattle neighborhoods
  • Heavy rainfall increasing ground movement
  • Tree root density in residential areas
  • Varied soil types across regions

This is why many homeowners rely on Professional sewer installation services to evaluate both cost and technical feasibility before choosing a method.

Conclusion

When comparing trenchless vs traditional sewer repair cost, there is no one-size-fits-all answer for Washington homeowners. Trenchless repair offers less disruption and long-term value, while traditional excavation may be more cost-effective in severe pipe failure cases. The best choice depends on pipe condition, property layout, and long-term restoration costs. In many Seattle-area homes, investing in the right method upfront prevents significantly higher expenses later.

FAQ Section

1. Is trenchless sewer repair more expensive than traditional repair?

Yes, trenchless repair usually has a higher upfront cost, but it often saves money by reducing restoration expenses like landscaping, driveways, and concrete replacement.

2. How long does trenchless sewer repair last in Washington?

Trenchless sewer pipes can last 50 years or more, depending on soil conditions and pipe material used during installation.

3. What is the cheapest sewer repair option?

Traditional excavation is usually cheaper initially, especially for short or easily accessible pipe sections, but restoration costs can increase total expenses.

4. Can all sewer lines be repaired with trenchless methods?

No, trenchless repair requires structurally intact pipes or specific conditions. Severely collapsed pipes usually need full excavation.

5. Do Seattle homeowners need permits for sewer repair?

Yes, most sewer repair projects in Seattle require permits and inspections to comply with local plumbing and environmental regulations.

Detached vs Attached ADUs: What’s Best in Washington?

Introduction: Choosing the Right ADU in Washington State

When planning adu construction Seattle WA, one of the most important decisions homeowners face is whether to build a detached or attached accessory dwelling unit (ADU). The choice directly impacts your construction cost, long-term rental income, permitting complexity, and how well the structure performs in Washington’s wet Pacific Northwest climate.

In simple terms, detached ADUs offer full separation from the main home, while attached ADUs share at least one wall or structural connection. In Seattle, Bellevue, Tacoma, and surrounding cities, this decision is shaped by lot size, zoning rules, and moisture-heavy weather conditions that affect building durability.

So, what’s better in Washington?
Detached ADUs provide more privacy and rental potential, while attached ADUs are typically more affordable and easier to integrate into existing structures. The right option depends on your budget, property layout, and long-term goals like rental income or multigenerational living.

This guide breaks down cost differences, design factors, permitting rules, and real-world performance in Washington’s climate so you can make a confident, informed decision.

What Is an ADU in Washington State? (Detached vs Attached Explained)

Accessory Dwelling Units (ADUs) are secondary housing units built on the same lot as a primary residence. Washington State has expanded ADU-friendly zoning in cities like Seattle to address housing shortages and affordability concerns.

Detached ADU

A standalone structure separate from the main home.
Common uses:

  • Backyard cottages
  • Rental units
  • Guest houses

Attached ADU

Connected to the main home through a shared wall or conversion of existing space.
Common uses:

  • Basement apartments
  • Garage conversions
  • Side additions

In Seattle’s dense neighborhoods, zoning laws often determine whether you can build detached structures based on lot coverage and setbacks.

Detached vs Attached ADUs: Key Differences in Washington Homes

To understand what works best for adu construction Seattle WA, you need to compare practical differences beyond just appearance.

1. Privacy & Rental Value

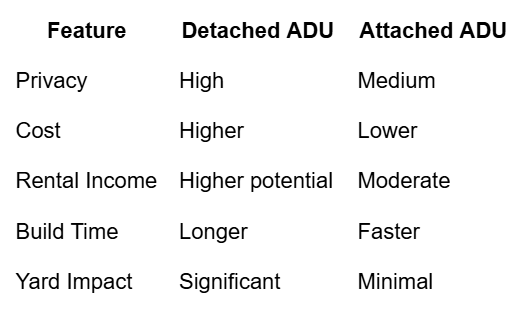
  • Detached ADUs offer full privacy → higher Airbnb or long-term rental value
  • Attached ADUs offer moderate privacy → better for family use

2. Construction Complexity

  • Detached: Requires full utility hookups (water, sewer, electrical)
  • Attached: Uses existing systems → lower engineering complexity

3. Space Efficiency

  • Detached ADUs require yard space
  • Attached ADUs maximize existing square footage

4. Noise & Separation

  • Detached: Better sound isolation
  • Attached: May require additional insulation upgrades

Comparison Table

From a contractor’s perspective in Washington, detached ADUs are increasingly popular in suburban areas like Bothell and Sammamish, while attached units dominate Seattle’s tighter urban lots.

At this stage of planning, many homeowners consult Everett, WA ADU construction experts to evaluate zoning feasibility, cost breakdowns, and site-specific constraints before committing to design.

Cost Breakdown: Detached vs Attached ADUs in Seattle (2026 Estimates)

Understanding cost is critical when evaluating adu construction Seattle WA projects, especially given Washington’s high labor and permitting expenses.

Detached ADU Costs

  • Average range: $220,000 – $450,000+
  • Higher due to:
    • Foundation work
    • Separate utility connections
    • Roofing and exterior siding

Attached ADU Costs

  • Average range: $120,000 – $300,000
  • Lower due to:
    • Shared structure
    • Reduced excavation
    • Existing plumbing/electrical tie-ins

ROI Considerations in Seattle Market

Seattle rental market data (2025 estimates):

  • 1-bedroom ADU rent: $1,800 – $2,800/month
  • Detached units often command 10–25% higher rent
  • ROI timeline: 7–12 years depending on financing

In high-demand neighborhoods like Ballard, Capitol Hill, and West Seattle, detached ADUs often outperform attached units due to tenant privacy expectations and lifestyle preferences.

Many homeowners evaluating ROI consult Crafthaus Remodel early in the design phase to align ADU layout decisions with long-term resale value and rental strategy.

Permitting and Building Codes for ADUs in Washington

Washington State and Seattle have specific ADU regulations that significantly influence design choice.

Key Requirements

  • Minimum lot size rules (varies by zoning)
  • Height restrictions (typically 24–30 ft for detached units)
  • Setback requirements (5–10 feet minimum in most zones)
  • Energy efficiency compliance (WA State Energy Code)

Permit Timeline

  • Seattle ADU permit approval: 4–9 months
  • Inspection phases: foundation, framing, final walkthrough

Climate Impact Considerations

Washington’s heavy rainfall means:

  • Proper drainage is mandatory
  • Mold-resistant materials are required
  • Roof pitch must handle moisture load

Detached ADUs often require additional waterproofing engineering, especially in flood-prone or tree-heavy neighborhoods.

Which ADU Type Works Best in Washington? (Decision Guide)

Choosing between detached and attached ADUs depends on your goals.

Choose Detached ADU if:

  • You want rental income optimization
  • You have a large backyard
  • You prioritize privacy
  • You plan long-term investment growth

Choose Attached ADU if:

  • You want lower upfront cost
  • Your lot size is limited
  • You prefer faster construction
  • You are converting existing space

Expert Insight from Seattle Builders

In Seattle’s competitive housing market, detached ADUs often deliver stronger appreciation and tenant demand, but attached ADUs remain the most practical solution for urban infill lots.

Homeowners often begin planning with Everett, WA adu construction experts to evaluate feasibility before architectural design begins.

Conclusion: Making the Right ADU Investment in Washington

In Washington’s evolving housing market, choosing between detached and attached ADUs is not just a design decision—it’s a financial and lifestyle strategy. Detached units offer higher rental value and independence, while attached units provide affordability and faster construction.

For most homeowners evaluating adu construction Seattle WA, the best choice depends on lot size, budget, and long-term income goals. Working with experienced professionals ensures your project aligns with zoning laws, moisture-resistant construction standards, and ROI expectations in the Seattle region.

FAQ: Detached vs Attached ADUs in Washington

1. What is the main difference between detached and attached ADUs?

Detached ADUs are standalone units built separately from the main house, while attached ADUs share at least one wall or structural connection. Detached units offer more privacy and rental value, while attached units are more cost-effective and easier to build within existing home structures.

2. How much does an ADU cost in Seattle, Washington?

In Seattle, ADU construction typically ranges from $120,000 for attached units to over $450,000 for detached units. Costs depend on size, site conditions, utility connections, and finishes. Detached units cost more due to separate foundations and infrastructure requirements.

3. Do ADUs require permits in Washington State?

Yes. All ADUs require permits in Washington State. In Seattle, the approval process typically takes 4–9 months and includes zoning review, structural plans, and multiple inspections to ensure compliance with state energy and safety codes.

4. Which ADU type has better rental income potential?

Detached ADUs generally generate higher rental income due to increased privacy and tenant appeal. In Seattle, detached units can earn 10–25% more rent compared to attached units, especially in high-demand neighborhoods.

5. Can I build an ADU on a small Seattle lot?

Yes, but attached ADUs are usually more suitable for smaller lots due to space limitations and zoning restrictions. Detached ADUs require sufficient yard space and setback clearance, which may not be available in dense urban areas.

Wood Fence Post Rot: Why It’s So Common in Pacific Northwest and How to Fix It

If you are dealing with leaning fence sections, soft wood near the base, or loose panels, you may need wood fence post rot Pacific Northwest repair services. Fence post rot is especially common in Washington, Oregon, and nearby coastal climates because wood posts are exposed to constant moisture, damp soil, moss growth, and long rainy seasons. Once rot begins below grade, fence stability can decline quickly.

The good news is that post rot can often be repaired if caught early. In some cases, only one post needs replacement. In others, several failing posts may mean it is smarter to rebuild sections of the fence. The right solution depends on how advanced the decay is, what material was used originally, and how drainage affects the fence line.

This guide explains why fence posts rot so often in the Pacific Northwest, how to identify the warning signs, and what contractors recommend for lasting repairs.

Why Fence Post Rot Is So Common in the Pacific Northwest

Wood fencing can last many years, but Pacific Northwest weather creates ideal conditions for decay.

Common causes include:

  • Frequent rainfall and wet winters
  • Soil that stays damp for long periods
  • Moss and algae holding moisture against wood
  • Irrigation overspray during summer
  • Poor drainage around posts
  • Organic mulch piled against fence bases
  • Low-quality untreated lumber

Unlike dry climates where wood can fully dry between storms, many western Washington areas stay damp for extended periods. That constant moisture speeds fungal decay.

How Fence Posts Usually Rot

Most homeowners assume posts rot above ground where they can see it. In reality, the most common failure point is at or just below soil level.

Wood Fence Post Rot Pacific Northwest Repair Starts at Ground Level

This area is vulnerable because it experiences:

  • Repeated wet/dry cycles
  • Oxygen exposure that feeds decay fungi
  • Soil moisture contact
  • Freeze-thaw movement in some regions

Even a fence that looks fine above ground can have serious hidden damage below grade.

Early Warning Signs of Fence Post Rot

Catching post rot early can save money and prevent full fence collapse.

Watch for These Symptoms:

  • Fence leaning or bowing
  • Panels wobble when pushed
  • Gates no longer latch correctly
  • Soft or spongy wood near post base
  • Cracks running vertically
  • Soil sinking around the post
  • Rusting fasteners due to moisture retention

If only one or two posts are affected, targeted repairs may restore the fence without full replacement.

For localized failures, many homeowners schedule fence post repair and replacement Seattle services to stabilize sections before wind or winter rain causes more damage.

How to Inspect a Fence Post Safely

A simple homeowner inspection can reveal a lot.

Step-by-Step Check:

1. Push gently on fence sections to test movement

2. Probe the base with a screwdriver

3. Look for dark discoloration or softness

4. Check if rails have separated from posts

5. Inspect drainage after rainfall

What Soft Wood Means

If a screwdriver sinks easily into the post near ground level, rot may already be advanced.

What Movement Means

If the fence sways, the buried section may be cracked or decayed.

Can a Rotten Fence Post Be Repaired?

Yes, but not every post should be repaired the same way.

Repair May Be Possible If:

  • Damage is limited to one post
  • Fence panels are still in good shape
  • Rot is moderate, not severe
  • Surrounding posts remain stable

Replacement Is Better If:

  • Multiple posts are failing
  • Fence is old and widespread decay exists
  • Rails and boards are also damaged
  • Fence leans in several areas

A professional evaluation helps determine whether repair or rebuild gives better value.

Common Repair Methods Contractors Use

Wood Fence Post Rot Pacific Northwest Repair Options That Actually Last

1. Full Post Replacement

The damaged post is removed and a new post installed with fresh concrete or approved footing methods.

Best for: Severe rot or structural movement.

2. Partial Section Rebuild

If panels and rails are also compromised, replacing one full section may be smarter than isolated repairs.

Best for: Older fences with mixed damage.

3. Reinforcement Brackets or Post Supports

Metal support systems may temporarily stabilize some posts if rot is minor and upper structure is still sound.

Best for: Limited short-term fixes.

4. Upgrade to Steel Post Core

Some homeowners replace wood posts with steel-supported systems while keeping wood panels.

Best for: Long-term durability upgrades.

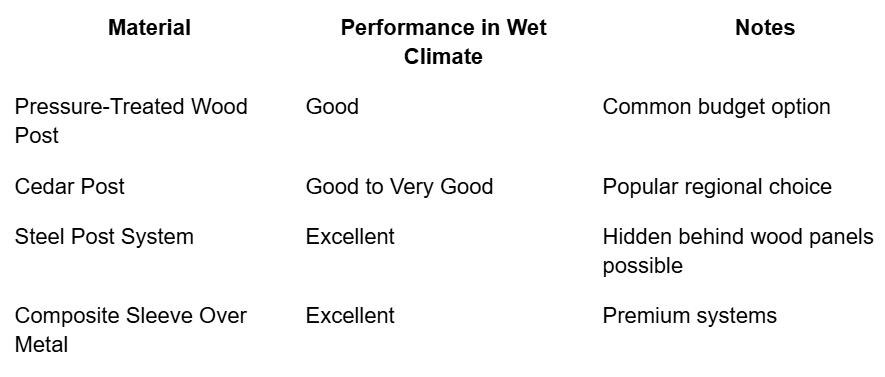
Best Replacement Materials for Washington Climate

Choosing better materials can prevent repeat problems.

Contractor Insight

Many Washington fence installers now recommend steel post systems for high-moisture yards where previous wood posts failed early.

Drainage Is Often the Real Problem

Replacing a rotten post without fixing drainage can lead to the same failure again.

Common Drainage Issues:

  • Downspouts emptying near fence line
  • Low spots holding water
  • Heavy clay soil
  • Overwatering lawns
  • Mulch packed against posts

Smart Solutions:

  • Redirect runoff
  • Improve grading
  • Use gravel zones where appropriate
  • Reduce irrigation overspray

Experienced companies such as Contour Fence often inspect surrounding drainage before replacing posts so new materials last longer.

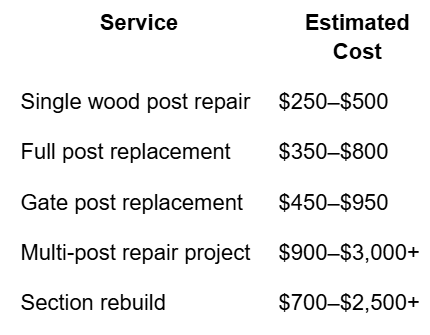
Typical Fence Post Repair Costs in Washington State

Costs vary by access, fence type, soil condition, and city labor rates.

Seattle and Bellevue pricing is often higher than smaller towns. Publishers should verify live local pricing.

DIY vs Professional Repair

DIY May Work If:

  • One short decorative section is loose
  • You have tools and digging experience
  • Utilities are clearly marked
  • Fence alignment is simple

Hire a Pro If:

  • Concrete footings must be removed
  • Multiple posts failed
  • Fence is tall or shared with neighbors
  • Gates need realignment
  • Slope or drainage issues exist

Incorrect post depth or alignment can create new problems fast.

How to Prevent Fence Post Rot in the Future

Prevention costs less than repair.

Annual Maintenance Checklist:

  • Inspect posts each spring
  • Keep mulch away from wood bases
  • Wash moss buildup
  • Reseal exposed wood when needed
  • Fix drainage problems early
  • Tighten loose hardware
  • Watch gate movement

Best Upgrade Strategy

If replacing multiple posts, ask whether steel-supported posts make more sense than repeating wood-only installations.

Washington-Specific Climate Considerations

Western Washington

Seattle, Tacoma, Olympia, Everett, and coastal areas usually face:

  • More rain
  • More moss
  • Higher soil moisture

Eastern Washington

Spokane and drier inland markets may see:

  • Less rot pressure
  • More cracking from dry heat
  • Freeze-thaw seasonal movement

Maintenance priorities vary by region.

When Full Fence Replacement Makes More Sense

Sometimes repairs are not economical.

Replace instead of repair when:

  • More than 30–40% of posts are failing
  • Rails are warped or broken
  • Boards are heavily rotted
  • Fence is near end of service life

A new fence may cost more upfront but save repeated repair bills.

Conclusion

Smart wood fence post rot Pacific Northwest repair starts with identifying why the posts failed, not just replacing damaged wood. In Washington’s wet climate, most rot begins at ground level where moisture stays trapped. Early repairs can save sections of fencing, but widespread decay may justify a larger rebuild. Whether you choose cedar, treated lumber, or steel-supported replacements, fixing drainage and moisture exposure is the key to long-term success.

FAQ Section

1. Why do fence posts rot faster than fence boards?

Posts stay in constant contact with damp soil and experience repeated wet/dry cycles at ground level, making them more vulnerable than boards above grade.

2. Can one rotten fence post be replaced without replacing the whole fence?

Yes. If surrounding rails and panels are still sound, contractors can often replace one failed post and reconnect the existing fence.

3. How long should wood fence posts last in Washington?

With proper materials and drainage, many posts last 15–25 years. Poor drainage or low-grade lumber can shorten lifespan significantly.

4. Is steel better than wood for replacement fence posts?

In many wet climates, yes. Steel-supported posts often resist rot and may outlast wood alternatives.

5. How do I know if rot is hidden underground?

Signs include leaning sections, wobble, soft wood near soil level, or gates going out of alignment. Underground decay is common.

Reliable Pest Control in Baton Rouge: What Homeowners and Businesses Should Expect

Pest issues in Baton Rouge are not just occasional inconveniences—they are an ongoing challenge influenced by Louisiana’s warm climate, high humidity, and dense residential areas. From ants in the kitchen to rodents inside walls, infestations can quickly escalate if not handled properly. This is why many residents turn to professional pest control in Baton Rouge services to protect their homes, families, and businesses.

Understanding how pest control works, what services are available, and what to expect from a provider helps you make informed decisions and avoid costly problems down the line.

Why Pest Control Is Essential in Louisiana

Louisiana’s environment creates ideal conditions for pests to thrive year-round. Unlike colder regions, Baton Rouge rarely experiences temperatures low enough to eliminate pest populations naturally.

Common issues in the area include:

  • Cockroaches (multiple species common in Louisiana homes) 
  • Ant infestations, including fire ants 
  • Rodents such as rats and mice 
  • Mosquitoes and ticks, especially in warmer months 
  • Bed bugs, which can spread quickly in both homes and businesses 

Because of this constant pressure, relying on reactive solutions is rarely enough. A structured pest control approach focused on prevention and monitoring is far more effective.

Risks of Ignoring Pest Problems

Pests are not just unpleasant—they can cause serious damage and health concerns.

Structural and Property Damage

  • Termites can weaken wooden structures over time 
  • Rodents can chew through wiring, insulation, and materials 
  • Insects can damage furniture and stored items 

Health and Safety Concerns

  • Cockroaches and rodents can spread bacteria 
  • Mosquitoes and ticks are linked to disease transmission 
  • Bites and stings from insects can cause allergic reactions 

Addressing these risks early with professional pest control is significantly easier than dealing with advanced infestations.

What Professional Pest Control Services Include

A reliable pest control provider does more than just treat visible problems. The goal is long-term protection through a structured system.

Typical Service Process

1. Inspection
A full evaluation of the property to identify pest types, entry points, and risk areas. 

2. Customized Treatment Plan
Solutions are tailored based on the property and infestation level. 

3. Targeted Application
Treatments are applied where needed instead of general spraying. 

4. Monitoring and Follow-Up
Continued evaluation ensures pests do not return. 

Year-Round Protection: What It Covers

One of the most effective approaches used in pest control in Baton Rouge is ongoing protection plans that cover a wide range of pests.

These typically include protection against:

  • Roaches (German, American, Oriental, and others) 
  • Ants (excluding certain species like pharaoh ants) 
  • Rodents (rats and mice) 
  • Silverfish and centipedes 
  • Crickets, earwigs, and millipedes 

This type of coverage ensures that both common and seasonal pests are managed continuously.

Termite Control: A Critical Service in Baton Rouge

Termites are one of the most costly pest problems in Louisiana. Because they often remain hidden, damage can occur long before homeowners notice any signs.

Why Termite Control Matters

  • Repairs from termite damage can cost thousands 
  • Infestations can spread through structural wood 
  • Early detection is difficult without inspection 

Professional termite control services focus on both treatment and prevention, helping protect properties long-term.

Bed Bug Treatments and Modern Solutions

Bed bugs are another growing concern, especially in urban environments and shared spaces.

Effective treatment requires:

  • Accurate identification 
  • Advanced equipment and techniques 
  • Strategic application to eliminate all life stages 

Modern pest control providers use updated methods to reduce infestations and prevent recurrence.

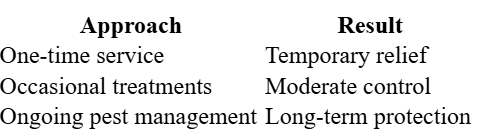
Comparing One-Time Treatments vs Ongoing Protection

For most Baton Rouge properties, ongoing pest control delivers the most reliable results.

Service Areas Around Baton Rouge

Professional pest control providers typically serve not only Baton Rouge but also nearby communities, including:

  • Baker 
  • Zachary 
  • Central 
  • Denham Springs 
  • Greenwell Springs 
  • Shenandoah 
  • Westminster 
  • Village St. George 

This regional coverage ensures consistent service across both residential and commercial areas.

What to Look for in a Pest Control Company

Choosing the right provider makes a significant difference in results.

Key factors include:

  • Certified and trained technicians 
  • Transparent inspection and pricing process 
  • Preventive treatment plans 
  • Consistent follow-up services 
  • Strong local reputation 

Working with a trusted company ensures that pest problems are handled correctly from the start.

Why Prevention Is More Effective Than Reaction

The most important shift in modern pest control is moving from reactive treatments to preventive strategies.

A strong prevention plan includes:

  • Regular inspections 
  • Sealing entry points 
  • Monitoring pest activity 
  • Applying targeted treatments when needed 

This approach reduces both the frequency and severity of infestations over time.

A Smarter Approach to Pest Control in Baton Rouge

Pest problems in Baton Rouge are not something that disappear on their own. The combination of climate, environment, and urban density creates continuous pressure that requires a structured response.

Professional services like those offered by J&J Exterminating combine experience, technology, and long-term planning to provide reliable pest control Baton Rouge solutions. By focusing on prevention as much as treatment, they help homeowners and businesses maintain a safer and more stable environment throughout the year.